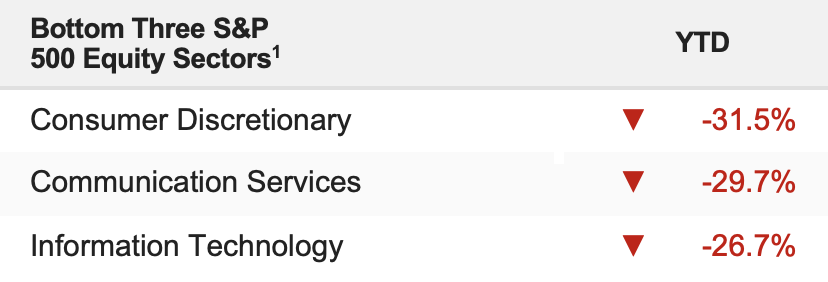
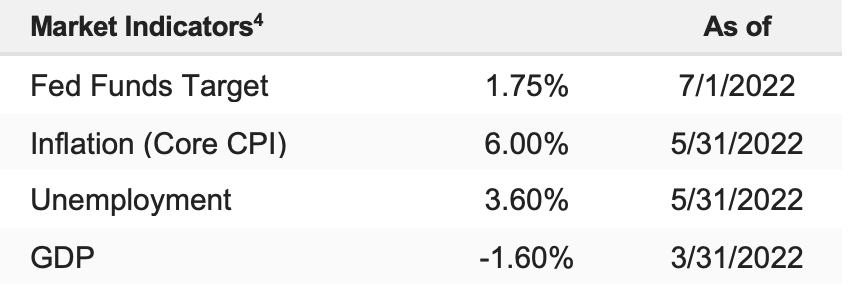
Stocks declined into the end of the second quarter last week as inflation expectations came in higher than expected. At the same time, economic data pointed to a more pronounced slowdown in growth in the wake of the Fed’s latest tightening actions. The S&P 500 fell 2.21% on the week and is now down 19.74% YTD.
Stocks had a volatile end to the second quarter on Thursday as markets dropped sharply on recession fears following the second guidance cut by RH in a matter of weeks, which dented the outlook for corporate earnings. Economically, the Core PCE price index, which is the Fed’s preferred measure of inflation, favorably slowed by more than expected (0.3% vs. (E) 0.4%), but a measure of consumer spending fell much sharper than expected to just 0.2% vs. (E) 0.5%, which raised concerns that the Fed’s policy moves have become a material headwind on growth.
The S&P 500 dropped another 0.88% on the session, and it was notably the worst start to a year since 1970.
Equities remained volatile at the start of the third quarter on Friday as investors repositioned portfolios and digested another guidance cut, this time from MU, citing a sharp drop in demand. The ISM Manufacturing Index also missed estimates (53.0 vs. E:55.0) which compounded growth concerns and recession fears. Stocks fluctuated before rallying into the close on positioning money flows into the new quarter. The S&P 500 rose 1.06%.
Calls for an economic contraction (or recession) have become louder as we and others have covered. So as we start the second half of the year, we want to address whether current stock market declines have priced in a material economic contraction. The analysis shows that while markets have priced in a more complex environment, we’re still more than 10% from a level that we could expect if a material economic slowdown materializes and lasts.
Here’s Why
The 2023 S&P 500 expected earnings have dropped sharply in the past several weeks. Analysts expected 2023 S&P 500 earnings (so next year’s earnings) to be around $240, but given the pre-announcements of the past six to eight weeks, that expectation now has dropped to between $220-$230. So, taking the midpoint of $225 expected S&P 500 for 2023, at 3,800 the S&P 500 is trading at 16.9X. That’s definitely not anywhere that’s considered “expensive” on a next year’s earnings basis. Still, it’s not as low as we could see the multiple should we get a material economic slowdown.
During sustained economic contractions, most analysts pencil in a 15X multiple as a level that appropriately prices in slowing growth. In that instance, 15 * 225 = 3,375 as a level in the S&P 500 that fully reflects declining economic growth and the current earnings drop, and that’s more than 10% from here. If earnings expectations fall farther (to $210 or even $200), then the valuation “floor” on this market falls to 3,150 or 3,000 in the S&P 500 (more than 20% lower from here, which would bring the total S&P 500 decline to nearly 50% from the highs).
While there is a litany of recession calls from the financial media, they are not being confirmed by market-based indicators. 10s-2s (bonds) haven’t materially inverted, and other parts of the yield curve remain solidly positive. Additionally, the BAA corporate bond spread, which measures the bond market’s expectations of profit stress on corporations and has been a good recession indicator, remains below levels that scream “recession.”
Of course, all this can change, and we will continue to watch these and other indicators. But for now, while we can’t say the S&P 500 is pricing in a material economic contraction (which leaves us vulnerable to further declines if one occurs), other markets aren’t forecasting that contraction, either.


